Five years of weather in 30 Indian cities
Daily data from 2021 to 2025, what it shows, and how it compares with the official record.
We collected 54,780 days of weather: one row per city per day, for 30 cities, five full years. Most of what follows is what you would expect from Indian weather, measured. Three quarters of the rain comes with the monsoon, the north swings between cold winters and fierce summers, and the coast barely changes. Some of it is less expected, including how far a weather model's numbers can sit from a thermometer's, and how we found that the data in the first version of this project was partly made up.
First, the data had to be real
The first version of this project used a downloaded dataset with humidity and pressure columns. The charts looked plausible. The numbers did not: Srinagar came out as humid as Mumbai, and Mumbai's humidity did not rise in the monsoon.
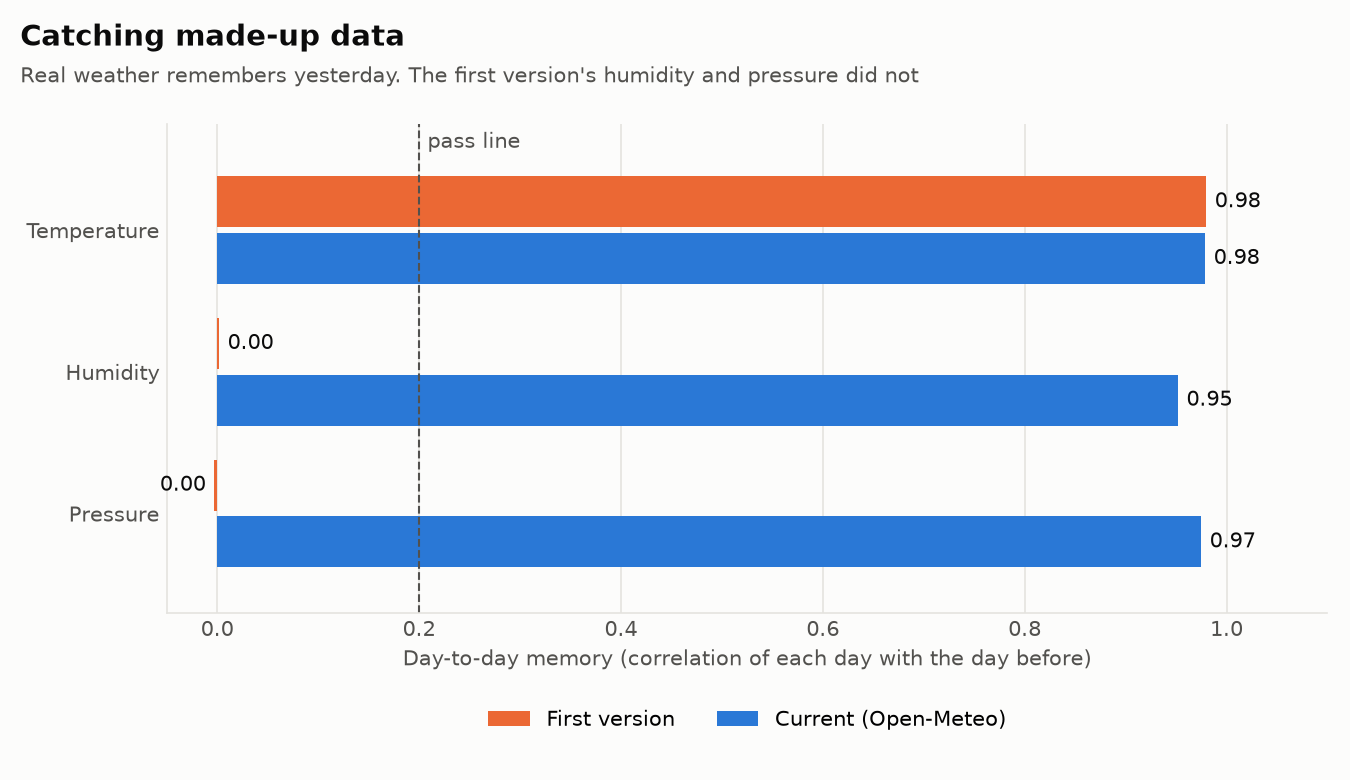
Real weather has habits that random numbers lack. Today is close to yesterday. The month of the year explains much of the variation. And cities differ from each other by more than chance. We turned each habit into a score and ran it on both datasets.
| Dataset | Variable | Memory | Seasons | Cities differ | Verdict |
|---|---|---|---|---|---|
| First version | Temperature | 0.98 | 0.84 | 0.49 | looks real |
| First version | Humidity | 0.00 | 0.00 | 0.02 | looks random |
| First version | Pressure | 0.00 | 0.00 | 0.02 | looks random |
| Current | Temperature | 0.98 | 0.82 | 0.65 | looks real |
| Current | Humidity | 0.95 | 0.67 | 0.34 | looks real |
| Current | Pressure | 0.97 | 0.82 | 0.24 | looks real |
The old temperature passes. The old humidity and pressure score close to zero on every test, the same as a column of random numbers we generated for comparison. So we rebuilt the project on data from Open-Meteo, where every variable passes. The test runs on every build, and our own tests check that it tells weather-like data from noise.
Look up a city
Show me
Delhi averages 24.7 °C. Its hottest day in these five years was 46.0 °C on 26 May 2024, and its coldest night 3.2 °C on 18 January 2023. It gets about 845 mm of rain a year, 80% of it from June to September.
The city lookup needs the page to be served rather than opened as a file. Run python run_all.py --serve and open localhost:8000.
Temperature by month, °C
Rain by month, mm
this citydaily low to highaverage of all 30 cities
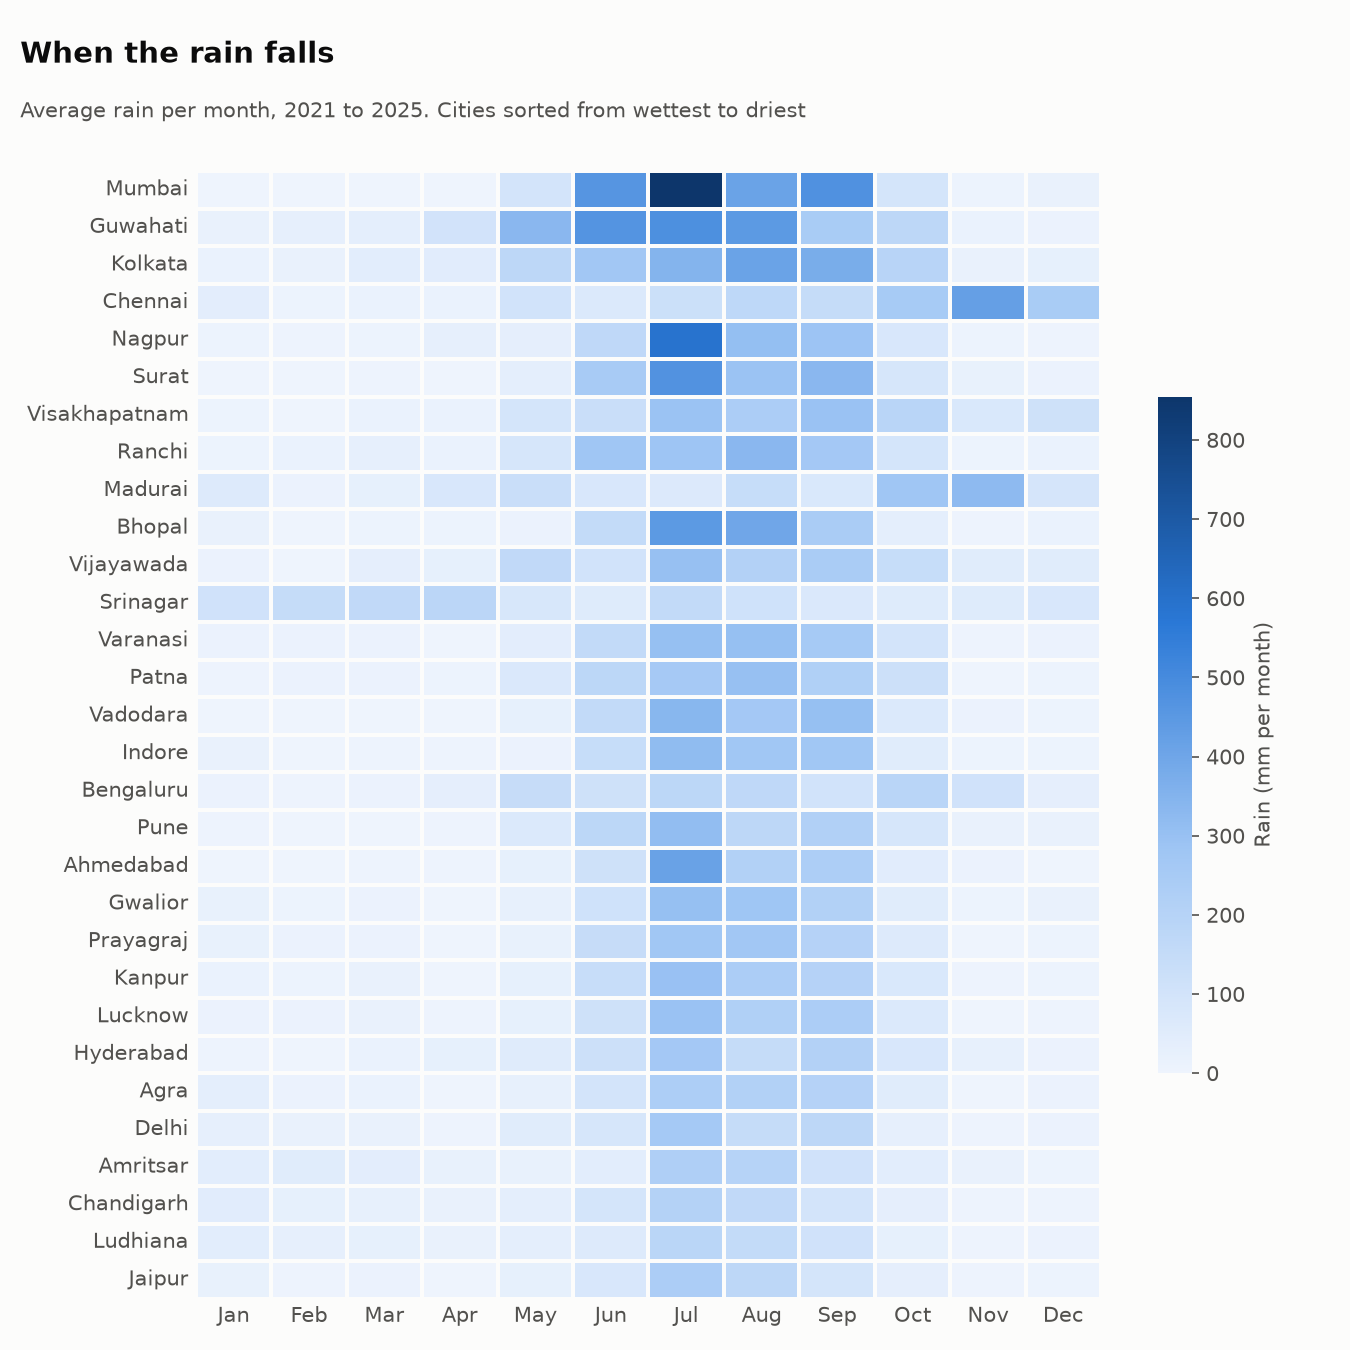
The monsoon brings three quarters of the rain
Across the 30 cities, 74% of the rain falls between June and September. The India Meteorological Department (IMD) puts the national figure at about 75%,1 so this sample matches the country as a whole. Mumbai is the wettest city at about 2,434 mm a year, with 855 mm in an average July. Jaipur is the driest at about 696 mm.
Chennai and Madurai keep a different calendar. They get 57% and 51% of their rain from October to December. IMD's Chennai office reports the same pattern for Tamil Nadu, where the north-east monsoon brings 48% of the year's rain because the state lies in a rain shadow during the south-west monsoon.2
2024 was a heatwave year
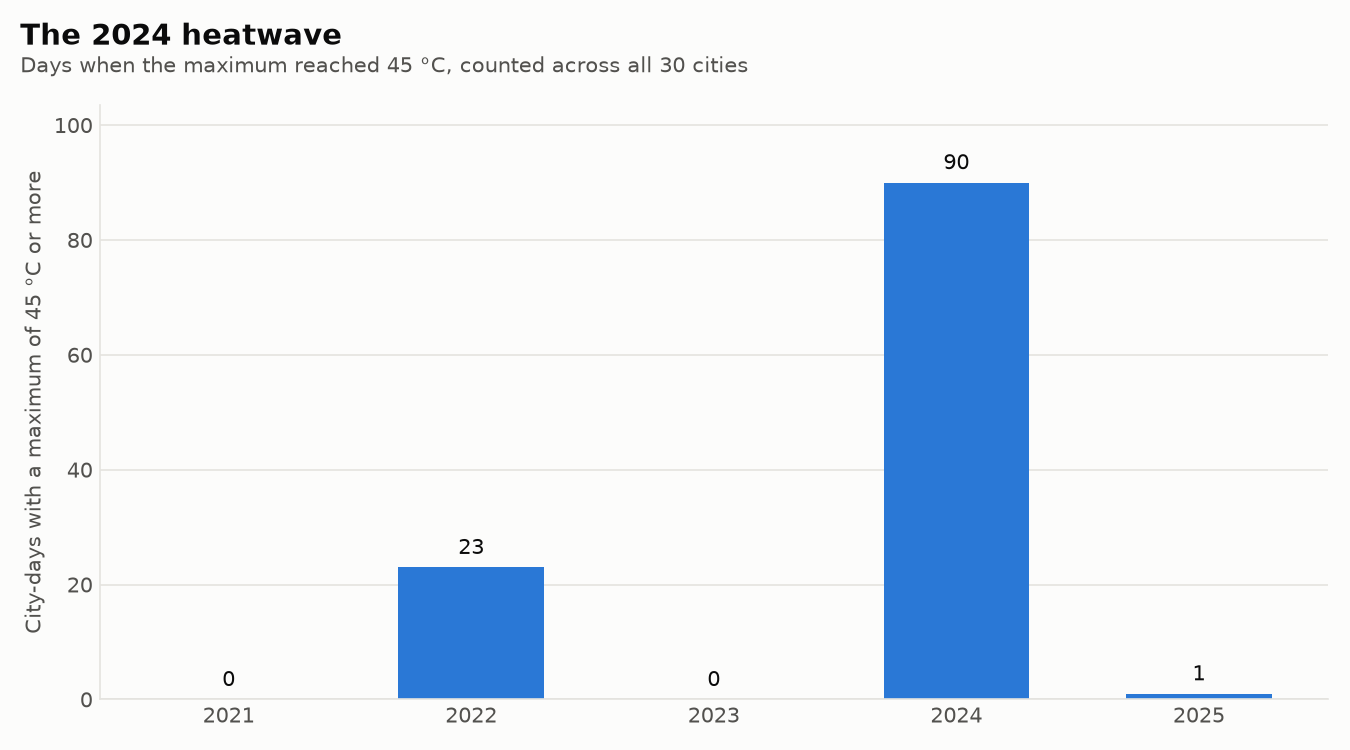
We counted the days when a city's maximum reached 45 °C. 2024 had 90 of them. 2022 had 23, and the other three years had one between them. Of the 2024 days, 64 fell in May, spread over 15 cities. The highest value in the data is 48.0 °C in Gwalior on 28 May 2024.
That same day, IMD stations recorded 50.5 °C in Churu and 49.9 °C at Mungeshpur in Delhi.3 Our figure for Delhi is 45.8 °C. The gap is expected. These values come from a weather model that averages a grid cell several kilometres across, which smooths away the hottest spots that a single thermometer records. The data is reliable for comparing cities and years, and it understates the peaks.
Each year was a little warmer
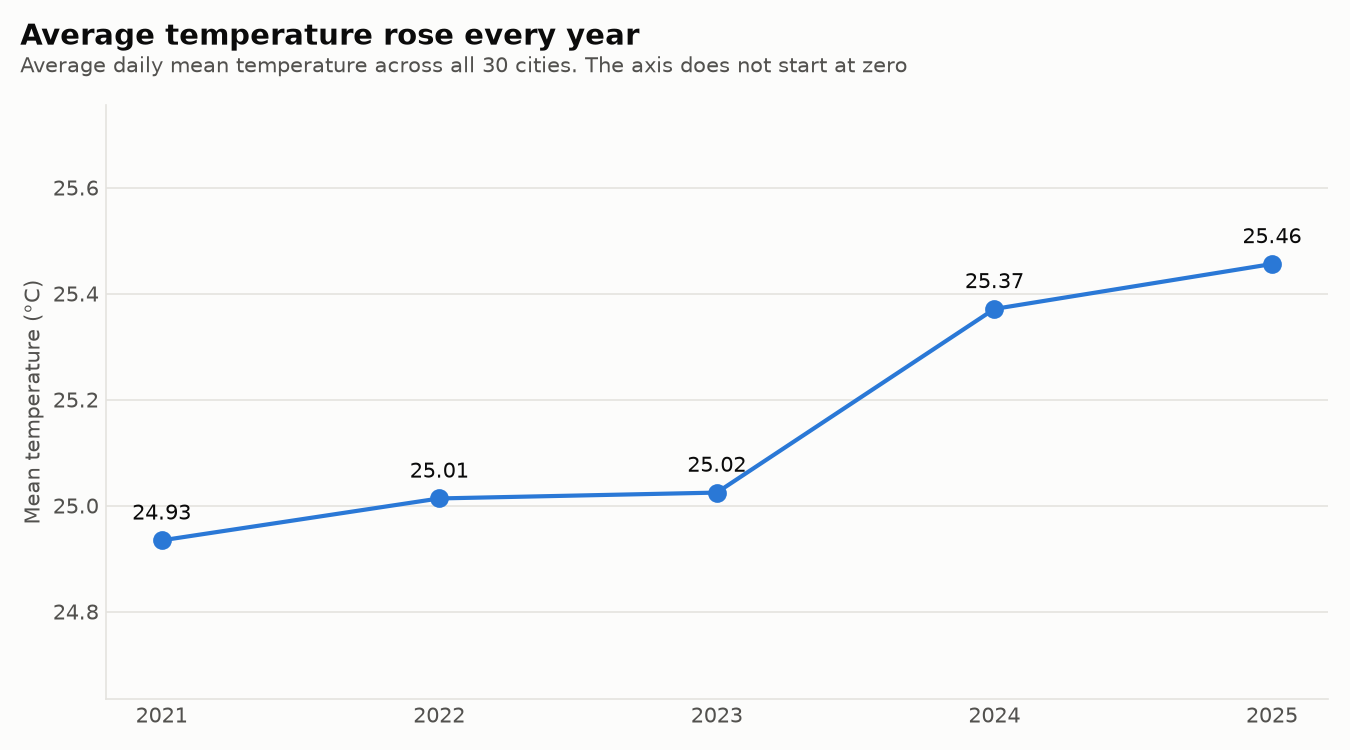
The average across all 30 cities rose every year, from 24.93 °C in 2021 to 25.46 °C in 2025, and 2025 was the warmest of the five years for half of the cities. IMD called 2024 India's warmest year since national records began in 1901, at 0.65 °C above the 1991 to 2020 average.4 Five years cannot show a trend on their own, but these point the same way as the long record.
The 2024 monsoon, close up
2024 was also the wettest monsoon of the five years, 16% above our five-year average. IMD measured it at 108% of its long period average for the whole country.5 The two figures are not directly comparable, since ours compares with five years and IMD's with decades, but they agree that 2024 was wetter than usual.
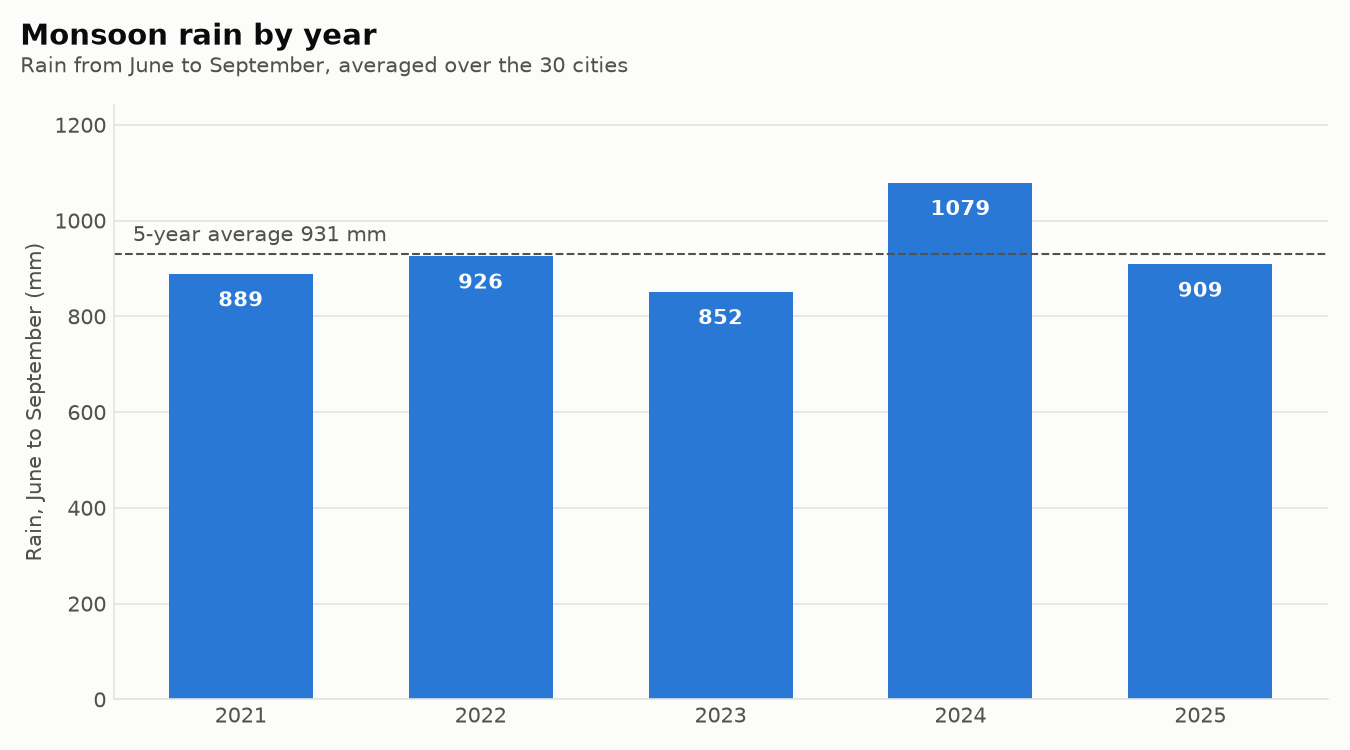
City by city it is messier. Chandigarh and Ludhiana got about 70% of their usual monsoon rain in 2024, while Vijayawada got 150%. Guwahati was 23% above its own average in our data, yet IMD reported north-east India as a whole at 86% of normal.5 One city is not a region, and modelled rainfall is less reliable than modelled temperature. A disagreement like this is a reason to look closer, not a finding to report.
The sea sets the swing
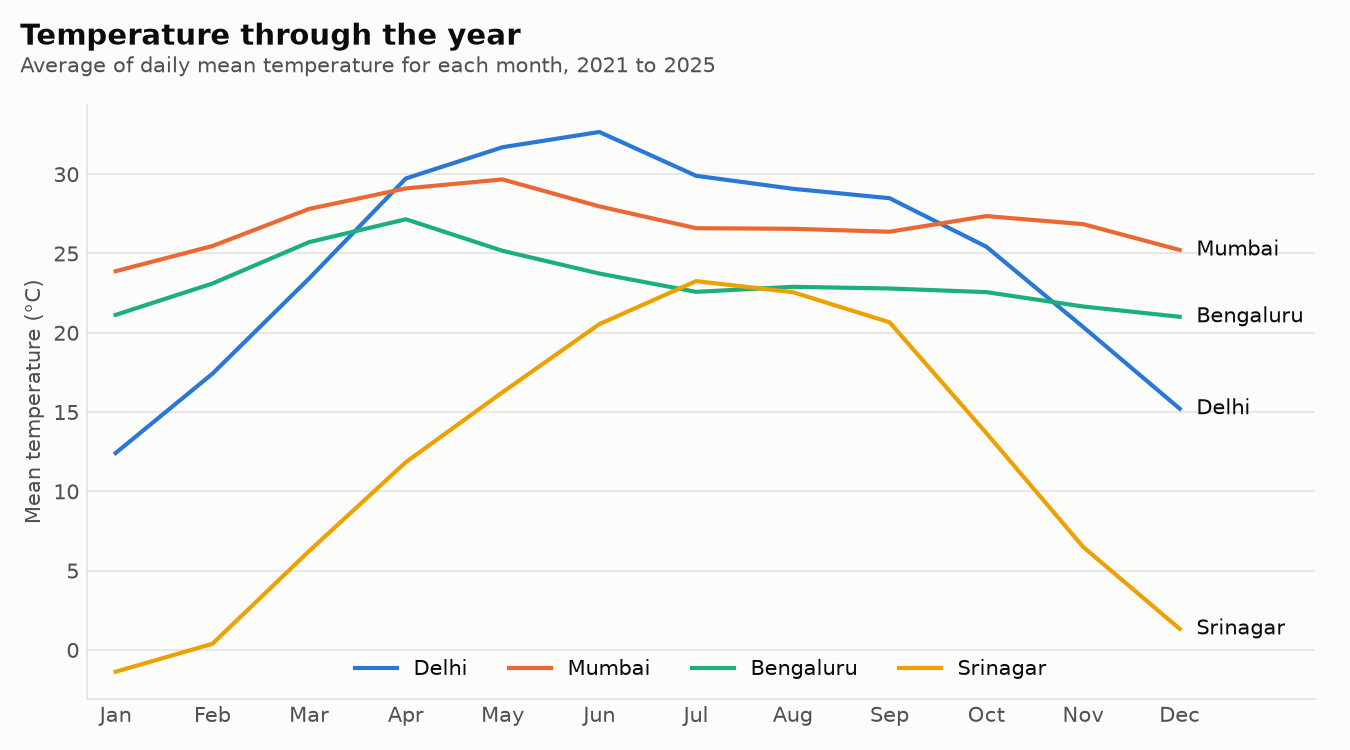
Madurai, Chennai and Mumbai stay within six degrees between their warmest and coolest month. Srinagar spans 24.6 degrees. Delhi is hottest in June rather than July, because monsoon cloud and rain take about three degrees off in July.
Hot months have low pressure
Average sea-level pressure falls from 1,015.7 hPa in January to 1,001.5 hPa in July, a mirror image of the temperature curve. Across all cities the correlation between the two is −0.76. Inside a single city it ranges from −0.92 in Srinagar to −0.29 in Pune. A correlation needs variation to show up, so Pune's weak figure says more about its mild climate than about the physics.
A third of the rain falls on ten days
On average, 35% of a year's rain falls on its ten wettest days. In Chandigarh it is 48%, in Kolkata 22%. Jaipur has about 54 days a year with at least 2.5 mm of rain, Guwahati about 148. Two cities with similar yearly totals can face very different flooding and storage problems.
About the data
Daily values come from the Open-Meteo Historical Weather API, which blends the ERA5 reanalysis (about 25 km cells), ERA5-Land (about 11 km) and the ECMWF IFS model (9 km).6 Every figure on this page is calculated from that data.
The limits are worth stating plainly. These are model estimates for a grid cell, not station readings. Five years is enough to compare cities and spot unusual years, not to measure climate change. And the 30 cities are mostly large ones, leaving out Kerala, most of the Himalaya and most of the north-east.
Run it yourself
With Python 3.12 and git installed, this rebuilds everything on this page in about 15 seconds and serves it at localhost:8000. The data is already in the repository.
git clone https://github.com/developwithsourav/Weather-Data-Visualization
cd Weather-Data-Visualization
python -m venv .venv
.venv\Scripts\activate
pip install -r requirements-dev.txt
python run_all.py --serve
On macOS or Linux, activate with source .venv/bin/activate.
Notes
- India Meteorological Department, Monsoon Report 2025, preface.
- India Meteorological Department, Regional Meteorological Centre Chennai, North-East Monsoon 2022 report.
- AIR News, Several parts of country continue to reel under severe heat wave conditions, 28 May 2024.
- India Meteorological Department, Annual Report 2024.
- India Meteorological Department, Salient features of the 2024 south-west monsoon season, 1 October 2024.
- Open-Meteo, Historical Weather API documentation. Weather data by Open-Meteo.com under CC BY 4.0.